We analysed 1,266 fatalities on Australia roads in 2023. Here’s what we learned.
We analysed 1,266 fatalities on Australian roads in 2023, to answer one question - how bad is the road toll?
We pored over road crash data from government sources like BITRE and ABS, analysing factors like vehicle type, age, gender, region, time of day, day of week and others to identify trends.
In this post, I’m going to share what we discovered.
Summary
- Australians aged 80-89 have the highest likelihood of dying in a road accident, at 9.2 deaths per 100,000 people.
- Males make up almost 76% of all road fatalities.
- Motorcycles travel only 1% of all passenger vehicle kilometres, but their riders make up 20% of all fatalities.
- Over one third (33.9%) of fatalities occur at speed limits of 60 km/h or below.
- The Darling Downs in QLD and New England in NSW are the most dangerous regions in the country, each with 21.7 deaths per 100,000 residents.
- Outback QLD and Shepparton in Victoria followed with 20.6 and 20.5 deaths per 100,000 residents, respectively.
- Inner South Melbourne was the safest region, with just 0.3 deaths per 100,000 residents.
- The weekend is the most dangerous period for road fatalities, with 37% of fatalities occurring.
- 3-4pm is the most dangerous time of day, with 6.3% of fatalities occurring in this hour.
- September is the most dangerous month of the year, with 10.4% of all road fatalities.
- Of the states and territories, Northern Territory gets the most road fatalities per person, with 12.3 deaths per 100,000 residents in 2023.
- ACT is the safest state/territory, with only 0.9 deaths per 100,000 residents.
- 2023 saw the highest road toll rate (4.8 deaths per 100,000 residents) since 2017.
Australians aged 80-89 have the highest likelihood of dying in a road accident
Age undoubtedly plays a significant role in determining risk of road crash and fatality for a particular individual. Insurance companies often use age as a factor when calculating car insurance premiums.
Younger, less experienced drivers are often thought to be the highest risk group, though our research found that in 2023 the 20-29 age group were actually the third highest risk group, behind people aged 80-89 and people aged 90-99.

80-89 year olds have a fatality rate of 9.2 deaths per 100,000 people, 90-99 year olds have a fatality rate of 7.7 deaths per 100,000, and 20-29 year olds have a fatality rate of 7.4 per 100,000 people.
The 100+ age group was excluded from this data point, as there wasn’t enough data to draw a significant conclusion.
Males make up the majority of road fatalities
In addition to age, gender is a factor used to determine an individual’s road crash and fatality risk. Men have historically made up a disproportionately large fraction of the road toll, and our study confirmed that this is still the case.
The Transport Accident Commission (TAC) in Victoria attributes this to many males being overconfident in their own driving abilities, resulting in them taking more risky behaviour.
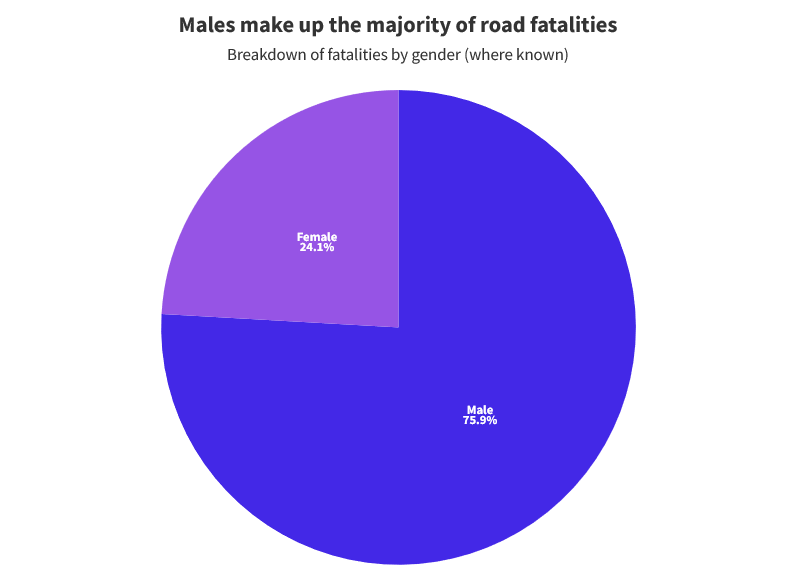
Males made up 75.9% of road fatalities where the gender of the victim was known in 2023.
Motorcycle riders and passengers make up a disproportionate fraction of road fatalities
Motorcycles are often reported as being more dangerous than conventional passenger vehicles.
Despite travelling only 1% of all passenger vehicle kilometres, motorcycle riders and passengers make up 20% of all fatalities.
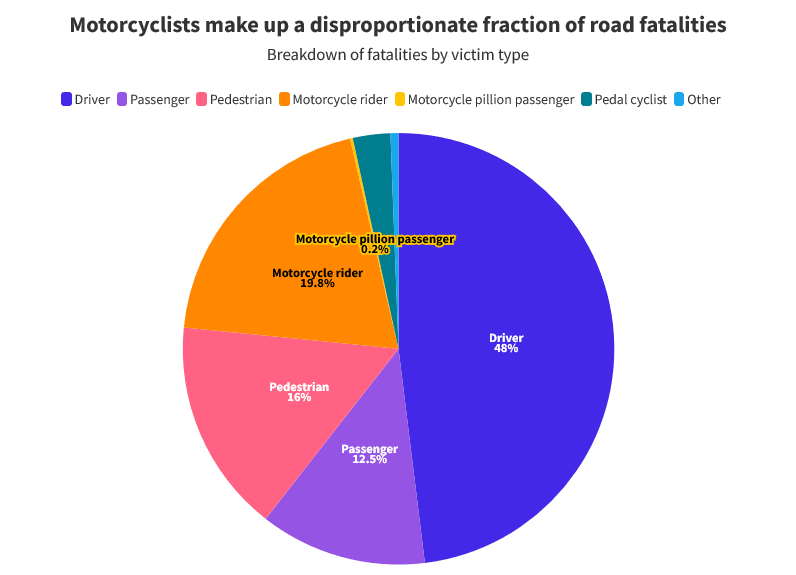
Many state and territory authorities are working hard to reduce motorcycle fatalities by educating riders to take greater care on the road.
Pedestrians made up 16% of fatalities.
Over one third of fatalities occur on low speed limit roads
We investigated whether there were any trends related to the speed limit of the road where the fatality occurred. While it is commonly thought that road fatalities occur on highways at high speed, our research found that this isn’t always the case.
In fact, over one third (33.9%) of fatalities occur at speed limits of 60 km/h or below.
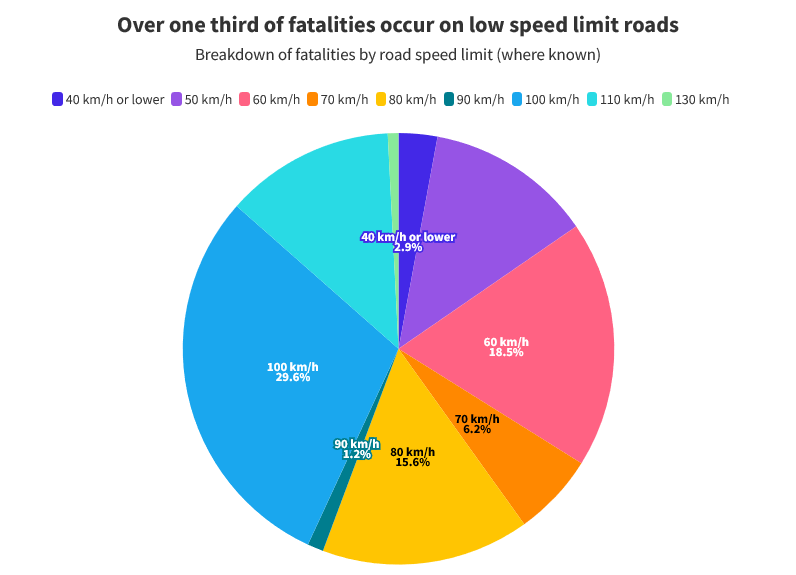
It’s worth remembering that road accidents on suburban roads can be fatal much like those on highways and motorways.
The Darling Downs (QLD) and New England (NSW) are the most dangerous regions in the country
We broke the fatality data down to the SA4 region level to see which regions have the most fatalities per population. Note that the Western Australia data is not broken down to region level, so no data is available for WA.
Darling Downs & Maranoa region in QLD and New England in NSW are the most dangerous regions in the country, each with 21.7 deaths per 100,000 residents.
Outback QLD and Shepparton in Victoria followed with 20.6 and 20.5 deaths per 100,000 residents, respectively.
Inner South Melbourne was the safest region, with just 0.3 deaths per 100,000 residents.
Generally speaking, regional areas seem to have the greatest number of road fatalities per population.
Use table below to search by region:
The weekend is the most dangerous period for road fatalities
Long weekends and other holiday periods are often targeted by state authorities as dangerous periods, due to congestion on the road.
Our study found that in general, the weekend is the most dangerous part of the week for road fatalities, with 37% of fatalities occurring.
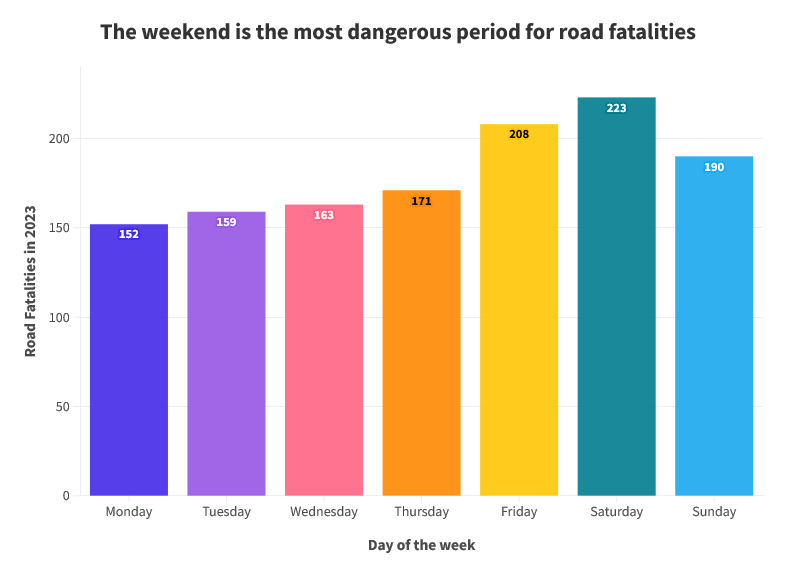
Monday is the safest day of the week, with just 12% of fatalities occurring on this day.
3-4pm is the most dangerous time of day
Time of day was also found to play a significant role, with afternoons and evenings being more dangerous than mornings.

In particular, 3-4pm is the most dangerous time of day, with 6.3% of fatalities occurring in this hour.
September is the most dangerous month of the year
The month of the year doesn’t play a large role in fatalities, though we did notice a spike in September, with a total of 10.3% of fatalities occurring in this month.
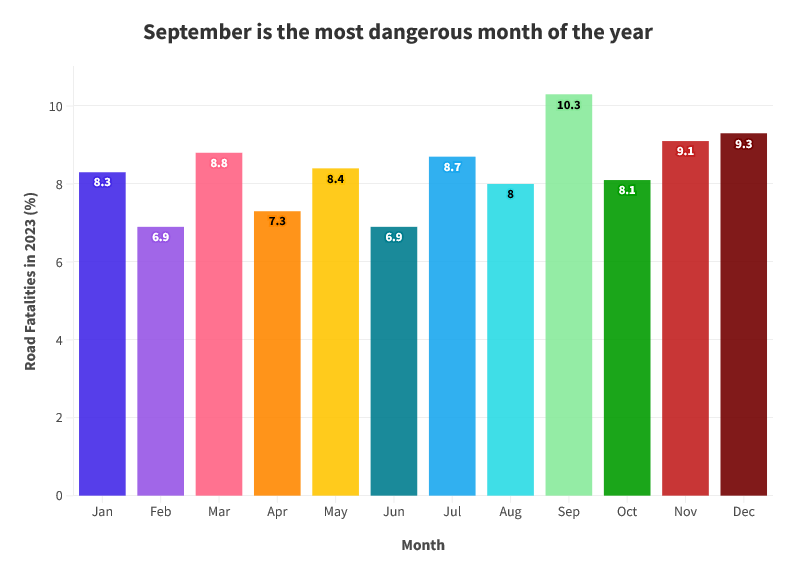
Only 6.9% of fatalities occurred in February and June each.
Of the states and territories, Northern Territory has the most road fatalities per person
Of the states and territories, Northern Territory gets the most road fatalities per person, with 12.3 deaths per 100,000 residents in 2023.
ACT is the safest state/territory, with only 0.9 deaths per 100,000 residents.
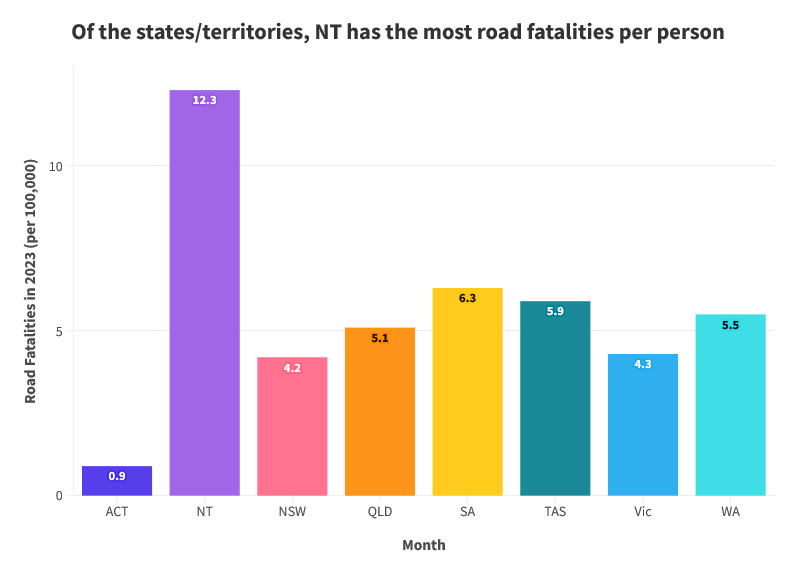
This shows once more that regional and remote areas tend to have greater rates of fatal road accidents.
2023 saw the highest road toll rate since 2017
Australia’s road toll rate has been dropping slowly but steadily since BITRE’s data began in 1989.
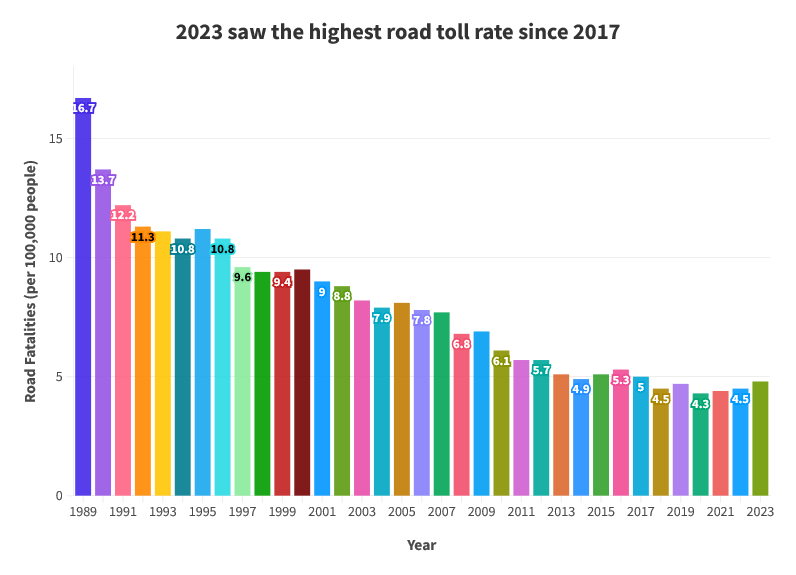
In 1989, there were 2,800 fatalities, despite Australia having a population of only 16.8 million. That meant a fatality rate of 16.7 deaths per 100,000 people.
In 2023, there were 1,266 fatalities for a population of 26.6 million, which meant a fatality rate of 4.8 deaths per 100,000 people.
However, this was the highest road toll rate since 2017.
Conclusion
Thanks for taking the time to look through our analysis of 1,266 road fatalities in Australia in 2023.
Feel free to quote any of the statistics, or use any of the charts in this report in your own work, as long as you provide attribution in the form of a link back to this page.
If you have any questions about this study, feel free to get in touch at louis@tyregeek.com.au.
Method
To prepare this analysis, publicly available Bureau of Infrastructure and Transport Research Economics (BITRE) data on all 1,266 road fatalities in Australia were gathered.
Analysis was carried out on the data to see if any trends emerged for factors like age, gender, vehicle type, location, date, time and more.
Where correlations and trends were found, they were charted and described in this report.
For more information on how this study was performed, or any other general questions, get in touch at louis@tyregeek.com.au.